Indianapolis Crime Rate What I Found in 2026
Which Indianapolis crime rate are we talking about, and what exactly does it measure? That question matters more than a single reassuring or alarming headline. A murder total, a nonfatal shooting count, a violent-crime rate, and a broad estimate covering property crime describe different parts of life in the city.
I'm Jill Hills, and I approach these numbers the way I'd explain them to a neighbor over coffee. If you're deciding where to live, visiting for the weekend, choosing where to go out at night, or trying to understand a headline, you need more than one citywide figure. You need the offense type, the time period, the geography, and the population used in the calculation.
The picture I found is mixed but understandable. Reported violent crime has declined from its pandemic-era peak, while Indianapolis still compares unfavorably with Indiana and the United States on the reported rate. Homicides, shootings, robbery, assault, property crime, clearance, and victim support don't all move together.
Why I Started Checking the Indianapolis Numbers
Is the Indianapolis crime rate answering the question I have? That is what I began asking after a friend wanted to know whether a neighborhood was suitable for an evening visit. Someone else was considering a move and comparing Indianapolis with nearby suburbs. Their questions sounded straightforward, yet the answer changed depending on the offense, the area, and the population used in the calculation.
I'm Jill Hills, and I read these figures as I would explain them to a neighbor over coffee. A citywide number gives useful context, but it cannot describe every block or every person's experience. It also cannot tell me whether a figure covers murder, all homicide classifications, shootings, robbery, assault, or property crime.
The labels matter. Murder is a narrower category than homicide, while a shooting count may include incidents that are not recorded as murder. A reported violent-crime rate combines selected offenses and divides them by a defined population. That denominator might cover city residents, a police department's service population, a metropolitan area, or a neighborhood. Comparing those figures without checking the boundaries is like comparing the temperature inside a house with the temperature across an entire county.
The questions I wanted answered
I kept four practical questions in front of me:
What changed over time? Did reported violence fall after the pandemic-era high point?
Which offenses moved? Did homicide change at the same pace as robbery, assault, or nonfatal shootings?
What area does the number cover? Is it Indianapolis city, the department's service population, the metropolitan area, or a neighborhood?
What does the number leave out? Reported incidents do not capture every event, and a rate cannot describe personal risk on every street.
FBI-derived Indianapolis figures show improvement in reported violent crime over the period examined, while the citywide rate still requires careful comparison with other places (Indianapolis violent-crime data).
My reading rule: A headline gives me a starting point, not a complete safety judgment.
I also check the dates before drawing conclusions. A murder figure from one year should not be blended casually with a violent-crime rate from another, and a city estimate should not be compared with a suburban figure unless their definitions match. That habit makes the Indianapolis crime rate easier to understand and more useful for real decisions.
How I Read a Crime Rate Without Getting Fooled
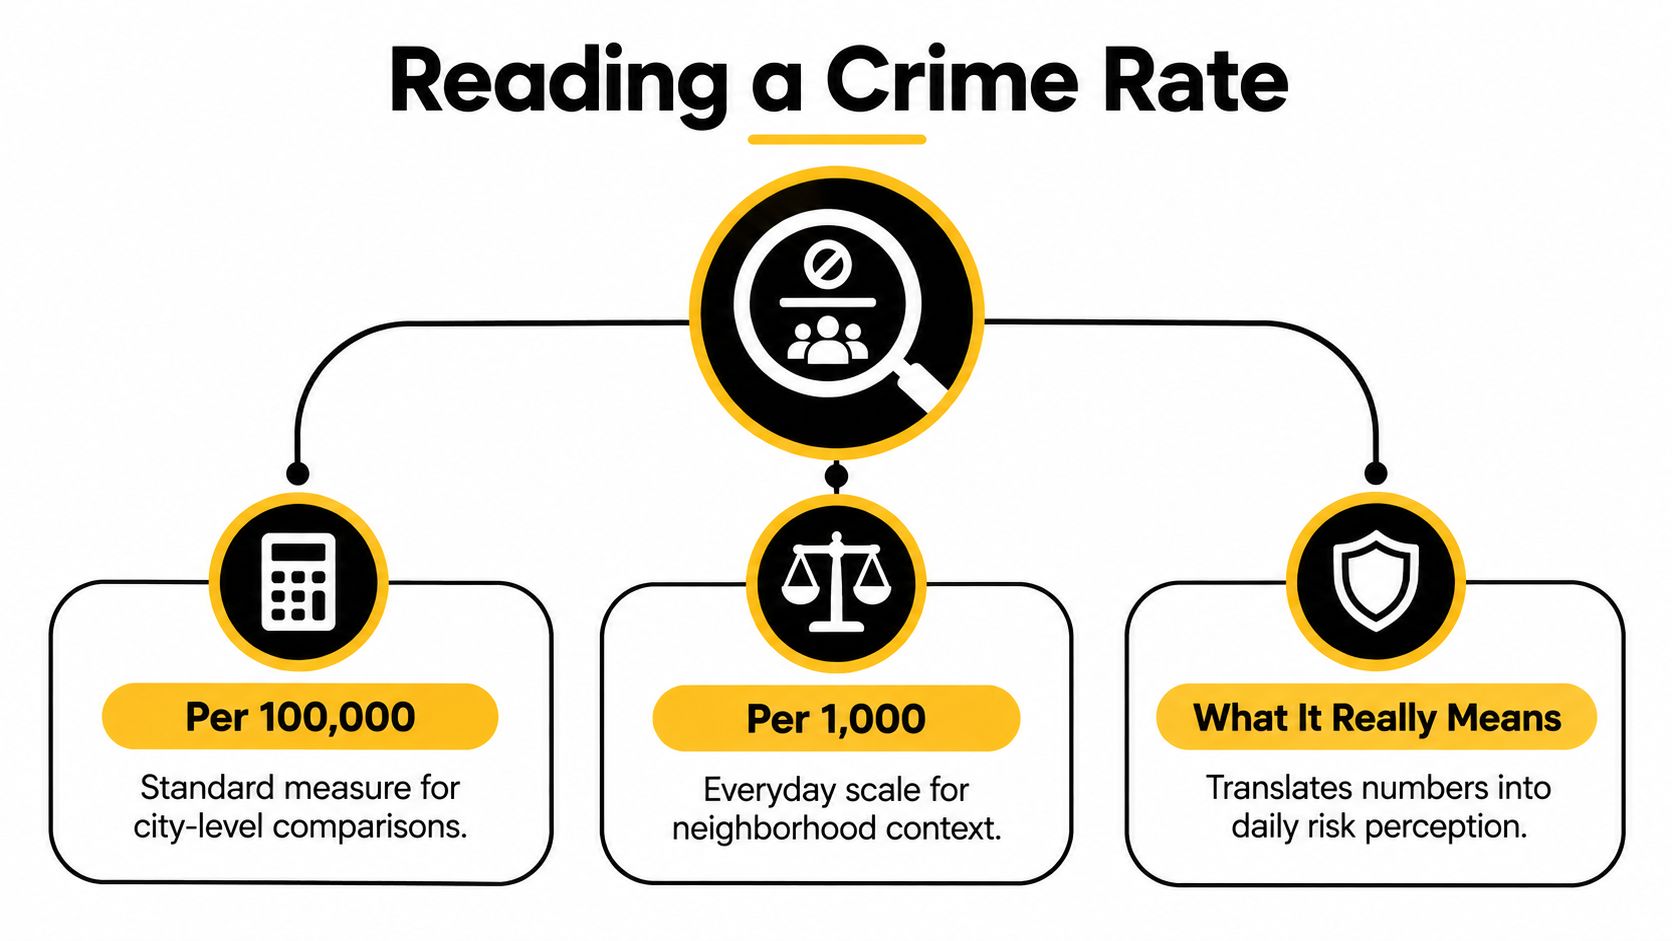
What does an Indianapolis crime rate measure? I start with the calculation: reported offenses divided by a defined population, then expressed on a standard scale. Per 100,000 residents is common for city comparisons because it puts places with different populations on a comparable scale. Per 1,000 residents applies the same method in a smaller unit.
The denominator is the population used in that calculation. A few missing packages on one block describe incidents there, not the rate for an entire neighborhood. Dividing by the block's population produces one result, while dividing by the city's population produces another. Both can be correct because they answer different questions.
Three checks I make before comparing figures
Identify the offense. “Violent crime” is a category, not another name for murder. Homicide, nonfatal shootings, robbery, and assault can follow different patterns, so one category cannot stand in for all of them.
Identify the denominator. A city rate may use residents served by a police department. A neighborhood figure may use a different boundary, population estimate, or data source. The people included in the denominator determine what the rate describes.
Identify what gets counted. Police-recorded figures measure incidents reported to authorities. They do not include every event, particularly incidents victims never report.
A simple example shows how the same offense count can produce different rates. If 8,342 offenses were divided by a service population of 890,685, the result would be 936.6 per 100,000. Dividing those same offenses by a metropolitan population of 977,000 would produce roughly 853 per 100,000. The offense count stayed fixed. Only the denominator changed (the department-based rate and population).
That difference can distort comparisons with suburbs or the wider metro area. Before I compare figures, I look for matching years, offense definitions, geographic boundaries, populations, and reporting systems. Otherwise, the numbers may appear precise while describing different slices of Indianapolis.
My practical rule is simple: a rate helps compare broad patterns, but it cannot predict what will happen to one person on one evening. I also consider the specific offense, neighborhood, time of day, current local reporting, and ordinary safety choices.
What Changed From the Pandemic Peak to 2024
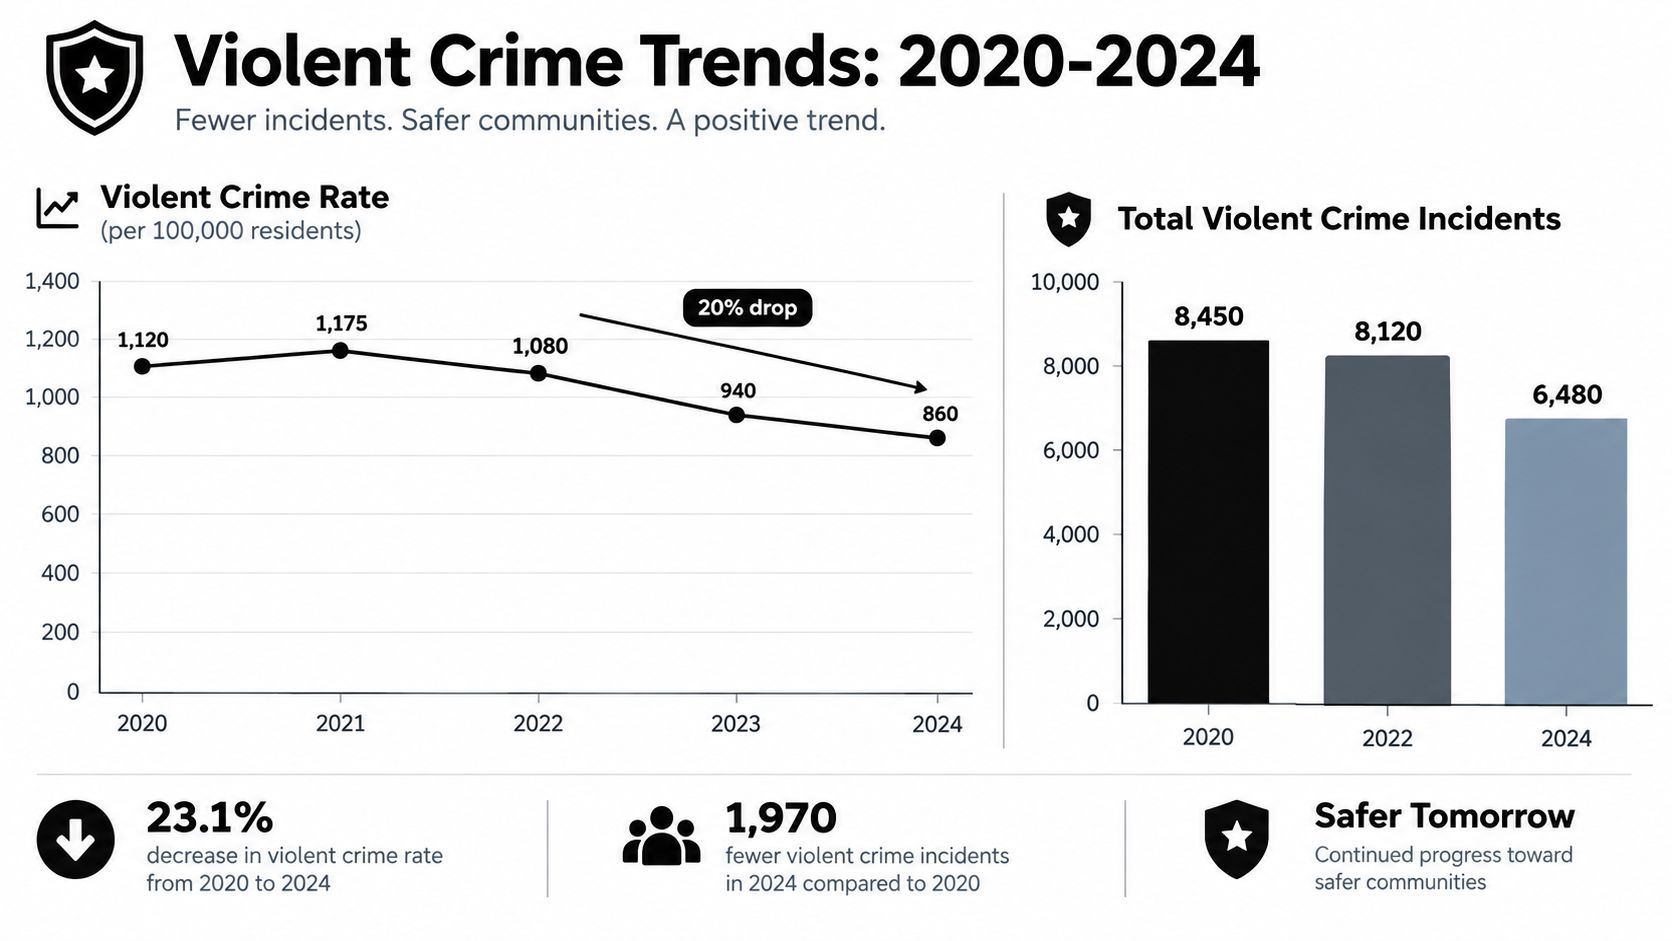
Did Indianapolis's violent-crime rate fall after the pandemic peak? The answer is more useful when we follow the full path rather than compare only two endpoints. FBI-derived figures reported by the Indianapolis Police Department show a rate of 1,096.9 per 100,000 in 2020. It remained above 1,000 per 100,000 in both 2021 and 2022, reaching 1,047.0 and 1,073.2 (Indianapolis rate history).
By 2024, the reported rate had fallen to 936.6 per 100,000 residents served. The decline from 2020 was about 14.6%, which sounds substantial. Yet the 2024 figure was still roughly 2.6 times the national rate of 363.4 per 100,000. That comparison gives the trend needed context: improvement from the pandemic-era high did not place Indianapolis near the national benchmark.
Progress and remaining distance
The city's 2024 reported violent-crime rate also remained well above Indiana's statewide rate of 349.2 per 100,000 and the national rate of 363.4 per 100,000. Those benchmarks do not describe every block or household. They show how the citywide measure compares with broader populations.
That distinction matters. A citywide rate can be shaped by concentrated problems in particular areas, while people elsewhere may experience a different daily reality. The figure is a wide-angle view, not a block-by-block forecast.
Reported crime also depends on whether people contact police, how incidents are classified, and which population the department uses in its calculation. These limits do not erase the downward trend. They define it more carefully: reported violent offenses declined, while the remaining reported rate stayed high relative to Indiana and the country.
I read the result in two parts:
The decline is real within this measure. Indianapolis recorded a lower reported rate by 2024 than during the pandemic peak.
The problem was not erased. The city still stood considerably above the statewide and national comparison rates.
I would not treat this rate as a verdict on Indianapolis. I use it as a trend indicator, then separate homicides, shootings, and other offenses before deciding what the numbers mean.
Homicides Shootings Robbery and Assault Tell Different Stories
How can a city's broad violent-crime rate fall while homicide still demands serious attention? Indianapolis shows why I separate the measures before drawing conclusions. In 2016, the city recorded a then-record 149 criminal homicides, while its violent-crime rate reached about 14 crimes per 1,000 residents, or roughly 1,400 per 100,000 (2016 crime milestone).
By the end of 2024, Indianapolis had recorded 173 criminal homicides, the same total reported in 2023. Police data also recorded 537 people injured in nonfatal shootings, about 10% fewer than the previous year. Those figures describe different kinds of harm, so I would not combine them into one score.
One city, several moving measures
Indicator | Recent result | What it means |
|---|---|---|
Criminal homicides in 2016 | 149 | A major historical milestone |
Criminal homicides in 2023 | 173 | A high annual total |
Criminal homicides in 2024 | 173 | Homicide remained level with 2023 |
People injured in nonfatal shootings in 2024 | 537 | Serious shooting harm declined from the prior year, but remained substantial |
Robbery, aggravated assault, and arson in 2024 | Down 19% to 34% | Broader categories fell faster than homicide, which stayed level at 173 |
The reported reductions in robbery, aggravated assault, and arson ranged from 19% to 34% in 2024 (2024 crime-category changes). That range explains why “crime went down” is incomplete. I ask which offense declined, by how much, and what the count measures: victims, investigations, offenses, or deaths.
The labels create another possible mismatch. Murder can be narrower than a broader homicide total. Homicide generally refers to a death caused by another person, while a shooting count can include people who survived. Nonfatal shooting investigations also are not identical to every aggravated assault involving a weapon. The denominator may cover reported incidents, victims, or residents, depending on the measure.
Local reporting adds useful context without replacing citywide data. This examination of a downtown Indianapolis shooting shows how the details of one event answer a different question from an annual crime category.
My rule is straightforward: keep homicide, shootings, robbery, and assault on separate lines. A rate can show direction, while the individual categories show what changed and who experienced the harm.
Neighborhood Numbers and City Versus Metro Comparisons
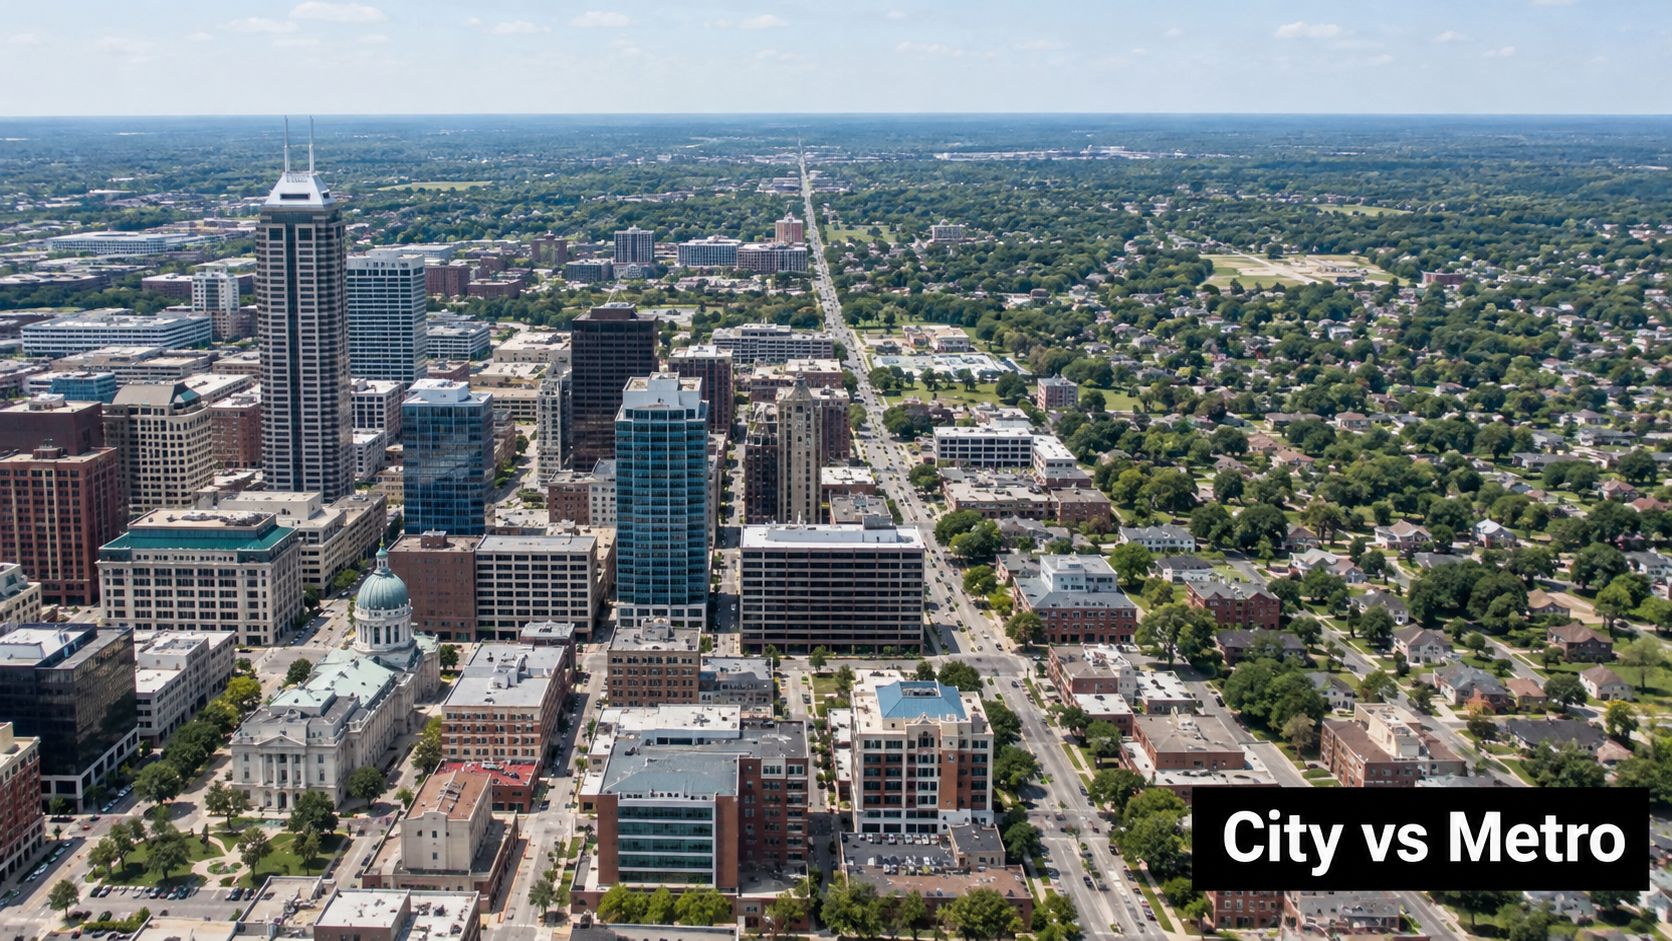
Could a citywide Indianapolis crime rate describe the block where I live? Only partly. Geography changes the answer before anyone calculates a rate. Indianapolis city limits, the police department's service area, Marion County, nearby suburbs, and the wider metropolitan area cover different populations and places.
One commonly cited 2024 estimate reports 41 crimes per 1,000 residents, including 8.68 violent crimes and 32.82 property crimes per 1,000 (the 2024 composite estimate). NeighborhoodScout's figure blends violent and property offenses across its own boundary definitions, so it cannot be set beside the 936.6 per 100,000 violent-crime rate as if both measures used the same denominator. The first is a combined estimate per residents; the second is a violent-crime rate with a different scope.
The geography test
Before I compare Indianapolis with a suburb or another city, I check four things:
Boundaries: City limits, police service areas, counties, and metro regions can produce different populations and incident totals.
Definitions: A composite estimate may combine violent and property offenses, while police reporting may separate murders, shootings, robbery, and assault.
Dates: A 2024 estimate and a 2025 police count describe different periods.
Sources: Reporting systems can classify incidents differently.
Those checks matter because murder, homicide, and shootings are not interchangeable labels. Murder is generally narrower than a broader homicide count, while a shooting measure may include people who survived. The denominator may cover residents, reported incidents, victims, or investigations, depending on the source.
The reported 2025 IMPD year-end figures show 133 murders, down from 166 in 2024 and 241 in the 2021 peak, while nonfatal-shooting investigations fell to 371, roughly 100 fewer than the prior year (IMPD 2025 year-end figures). These results indicate improvement in the measures reported, but they do not turn a citywide average into a neighborhood forecast.
For a rental decision, I would check neighborhood-level information, confirm the boundary and category definitions, and visit at the times I expect to be there. A daytime impression and a late-night routine can reveal different practical concerns. I would also compare local context using Indianapolis crime statistics by neighborhood, then check how its maps define each area. The goal is a fair comparison, not a permanent label.
Clearance Rates Gun Recoveries and Victim Support Matter Too
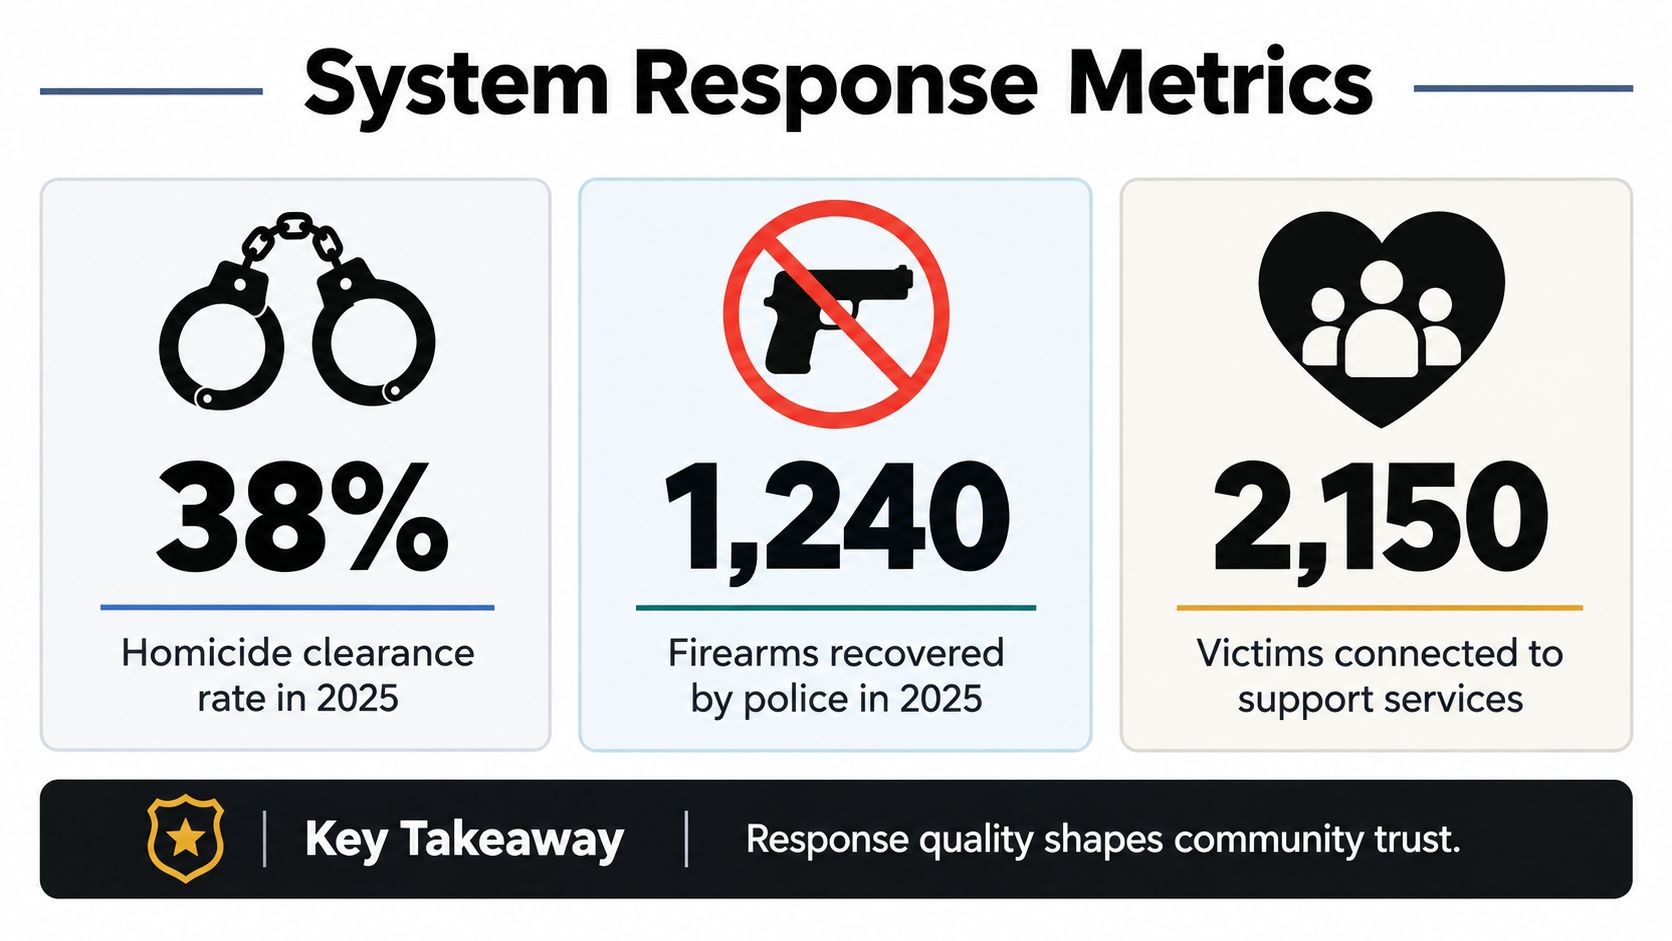
Could a lower Indianapolis crime rate still leave families waiting years for answers? I read public-safety figures through three separate dials: incidents, clearance, and support. Incidents show what entered the system. Clearance shows how cases were resolved under the justice system's definition. Support shows whether people harmed by crime could connect with help.
IMPD reported a 47% clearance rate for criminal homicides in 2025, while cases from earlier years combined for a rate above 80%. For nonfatal shootings, the reported clearance rate was 31%, according to IMPD clearance and victim-support reporting.
Why clearance isn't the same as safety
A clearance rate is not an incident rate. It measures cases resolved through the justice system's rules, so it cannot predict whether new violence will occur. It still matters: investigative follow-through can affect accountability, public trust, and families waiting for answers.
IMPD's Unsolved Homicide Unit conducted seven jury trials in 2025 and cleared eight cases involving 11 victims dating back to the 1990s. Nearly 3,500 crime victims connected with services through IMPD's Victims' Assistance Unit, figures included in the same IMPD clearance and victim-support reporting.
Firearms as a connected signal
IMPD specialized teams reported recovering 1,976 firearms in 2025, compared with 847 in 2024, and making nearly 2,800 arrests, up from more than 1,300 the previous year, according to reporting on firearm recoveries and arrests.
Those totals provide context, not proof that firearm recoveries alone caused violence to decline. Weapon seizures may reduce availability or interrupt high-risk networks, while national and regional cycles, enforcement changes, reporting behavior, and victimization patterns may also shape the results.
A fuller dashboard: Count incidents, examine clearance, and ask whether victims can access support.
I want all three measures in view. Fewer incidents matter, investigative follow-through matters, and practical support for people harmed by crime matters too.
What I Tell Friends Before They Decide How Safe They Feel
I don't tell friends that one number can decide whether Indianapolis is safe. I tell them to build a decision from several pieces: the trend, the offense, the location, and the limits of the data.
The 2025 direction was encouraging. IMPD-linked reporting counted 133 murders, down from 166 in 2024, a decrease of about 19.9%, and 371 nonfatal shooting investigations, 100 fewer than the prior year, or approximately 21.2% lower. Robberies and property crime also declined year over year, while a separate account reported nearly 2,000 firearm recoveries in 2025 versus 847 in 2024 (2025 crime and firearm trends).
That helps me understand direction, but it doesn't tell me what will happen on my specific route. If I'm choosing where to walk, park, rent, or meet friends, I also consider lighting, traffic, whether businesses are open, how familiar I am with the area, and whether local reporting describes a recent pattern.
My quick headline checklist
Check the date. Don't compare a current total with an older rate without saying so.
Name the offense. Murder, homicide, nonfatal shooting, robbery, assault, and property crime aren't interchangeable.
Read the denominator. Ask whether the figure uses city residents, a police service population, a county, or a metro area.
Separate reported from occurred. Police-recorded data can't capture every incident that goes unreported.
Look locally. A city average shouldn't determine how I judge one block.
Use practical judgment. Stay aware, plan transportation, share your route when appropriate, and understand relevant Indiana rules. This overview of Indiana self-defense law can help frame that legal question, though it isn't a substitute for legal advice.
My conclusion is calm and specific. Indianapolis has made measurable progress in reported violence, but its rate remains high against statewide and national benchmarks. Homicide still deserves separate attention, neighborhood differences matter, and the best reading combines incident trends with clearance and victim support instead of relying on one dramatic number.
Circle City News™ offers candid Indianapolis coverage, including crime statistics by neighborhood, local reporting, and practical context around crime, law, and community life. Visit Circle City News™ to keep following the numbers without losing sight of the people and places behind them.


Comments